Capturing a .HAR file can help diagnose network-related issues such as page load times, errors, and failed requests. Most modern web browsers, including Google Chrome, Mozilla Firefox, Microsoft Edge, and Safari, offer built-in tools for creating a .HAR file. This article provides step-by-step instructions for capturing a .HAR file in Google Chrome, as well as similar instructions for Firefox and Edge.
How to Capture a .HAR File in Google Chrome:
- Open Developer Tools:
- Right-click on the webpage and select Inspect or press
F12on your keyboard. - This will open the Chrome Developer Tools panel.
- Go to the Network Tab:
- In the Developer Tools panel, click on the Network tab.
- Ensure the recording button (a red circle) is active. If it’s gray, click it to start recording.
- Clear Existing Logs (Optional):
- Click the Clear button (a circle with a line through it) to remove any existing logs. This ensures the .HAR file will only capture the current session’s data.
- Reload the Page:
- Refresh the page you want to analyze. This will record all network requests made by the page.
- Stop Recording:
- Once the page has fully loaded, stop recording by clicking the red button again.
- Export the .HAR File:
- Right-click on any of the recorded network requests in the Network tab.
- Select Save all as HAR with content or Export HAR.
- Choose a location on your computer to save the .HAR file.
- Share or Analyze the .HAR File:
- You can now share the .HAR file for troubleshooting or analyze it using tools that support .HAR files.
How to Capture a .HAR File in Mozilla Firefox:
- Open Developer Tools:
- Right-click on the webpage and select Inspect Element or press
F12. - Click on the Network tab.
- Start Recording:
- Ensure the recording button (a red dot) is active.
- Refresh the page to capture the network activity.
- Export the .HAR File:
- Once the page has loaded, click the settings gear icon in the Network tab.
- Select Save All As HAR.
How to Capture a .HAR File in Microsoft Edge:
- Open Developer Tools:
- Right-click on the webpage and select Inspect or press
F12. - Go to the Network tab.
- Start Recording:
- Ensure the recording button (a red dot) is active.
- Refresh the page to capture the network activity.
- Export the .HAR File:
- Once the data is captured, right-click on any network request.
- Choose Save as HAR with content.
Capturing WebSocket Details in Google Chrome:
To capture WebSocket details in a .HAR file in Chrome, follow these steps:
- Open Chrome and navigate to the page where the issue is occurring.
- Select the ⋮ button and go to More Tools > Developer Tools.
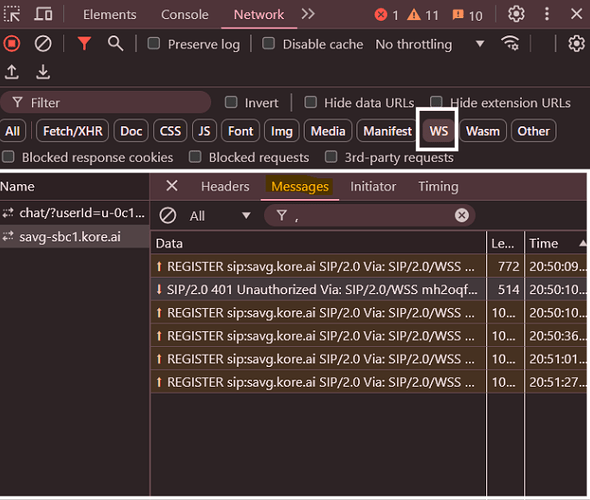
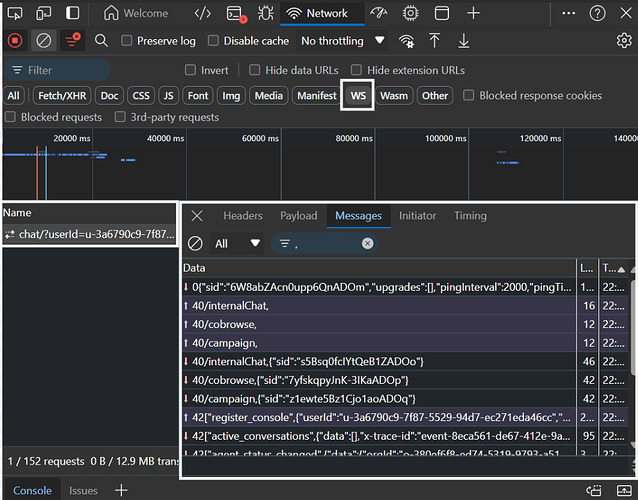
- Select the Network tab and click on the WS (WebSocket) tab.
- Check the Preserve log checkbox.
- Reload the browser to begin capturing WebSocket traffic.
- Reproduce the issue while the network requests are recorded.
- Click the download icon and select Export HAR to download the file.
- Save the .HAR file to your local device.
Capturing WebSocket Details in Microsoft Edge:
To capture WebSocket details in Microsoft Edge, follow these steps:
- Right-click on the webpage where the issue is occurring and select Inspect or press
F12on your keyboard to open the Developer Tools panel. - In the Developer Tools panel, click on the Network tab.
- Then, click on the WS (WebSocket) tab to filter WebSocket traffic.
- Check the Preserve log checkbox to ensure that network activity is captured even after the page reloads.
- Refresh the page to begin capturing WebSocket traffic.
- Perform the actions that trigger WebSocket communication, so the network traffic is recorded.
- Once the activity is captured, right-click on any of the WebSocket requests in the WS tab.
Select Save all as HAR with content to download the .HAR file. - Choose a location on your device to save the .HAR file.
Important Notes:
- Be cautious when sharing a .HAR file, as it may contain sensitive data like cookies, tokens, and other personal information transmitted over the network.
- .HAR files are especially useful for diagnosing network issues related to page load performance, errors, and failed requests.
By following these steps, you can capture a .HAR file to assist with troubleshooting and improving network performance.

