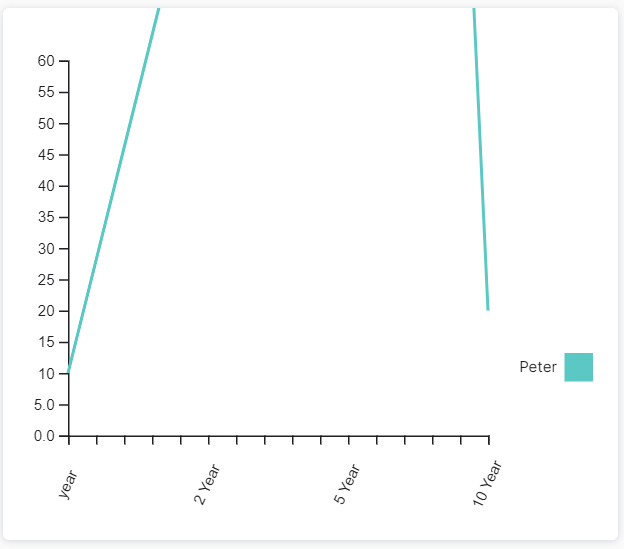
Is there a way to scale the Y-axis of the line chart?
No matter the values, it always shows 60 as max in the Y-axis.
This is the template I am using:
var elements = [{
“title”: “Peter”,
“values”: [10,100,500,20]
}
];
var X_axis = [“year”,“2 Year”,“5 Year”,“10 Year”];
var message = {
“type”: “template”,
“payload”: {
“text”: “Peter Sam Report”,
“template_type”: “linechart”,
“direction”: “horizontal”,
“X_axis”: [],
“Auto_adjust_X_axis”: “no”,
“elements”: [],
“speech_hint”: “Here is your report”
}
};
var ele = [];
for (var i = 0; i < elements.length; i++) {
var element = {
title: elements[i].title,
values: elements[i].values,
displayValues: elements[i].displayValues
};
ele.push(element);
}
message.payload.elements = ele;
message.payload.X_axis = X_axis;
print(JSON.stringify(message));