Hi @sushmita.nandi,
The parameters present in the documentation are the ones which are currently supported by Kore.ai Platform.
https://developer.kore.ai/docs/bots/sdks/message-templates/#Bar_Chart_Template
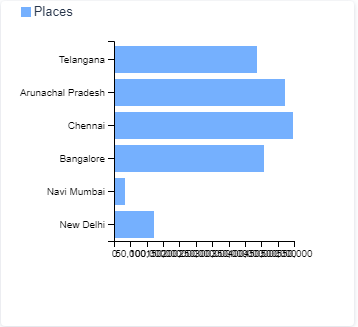
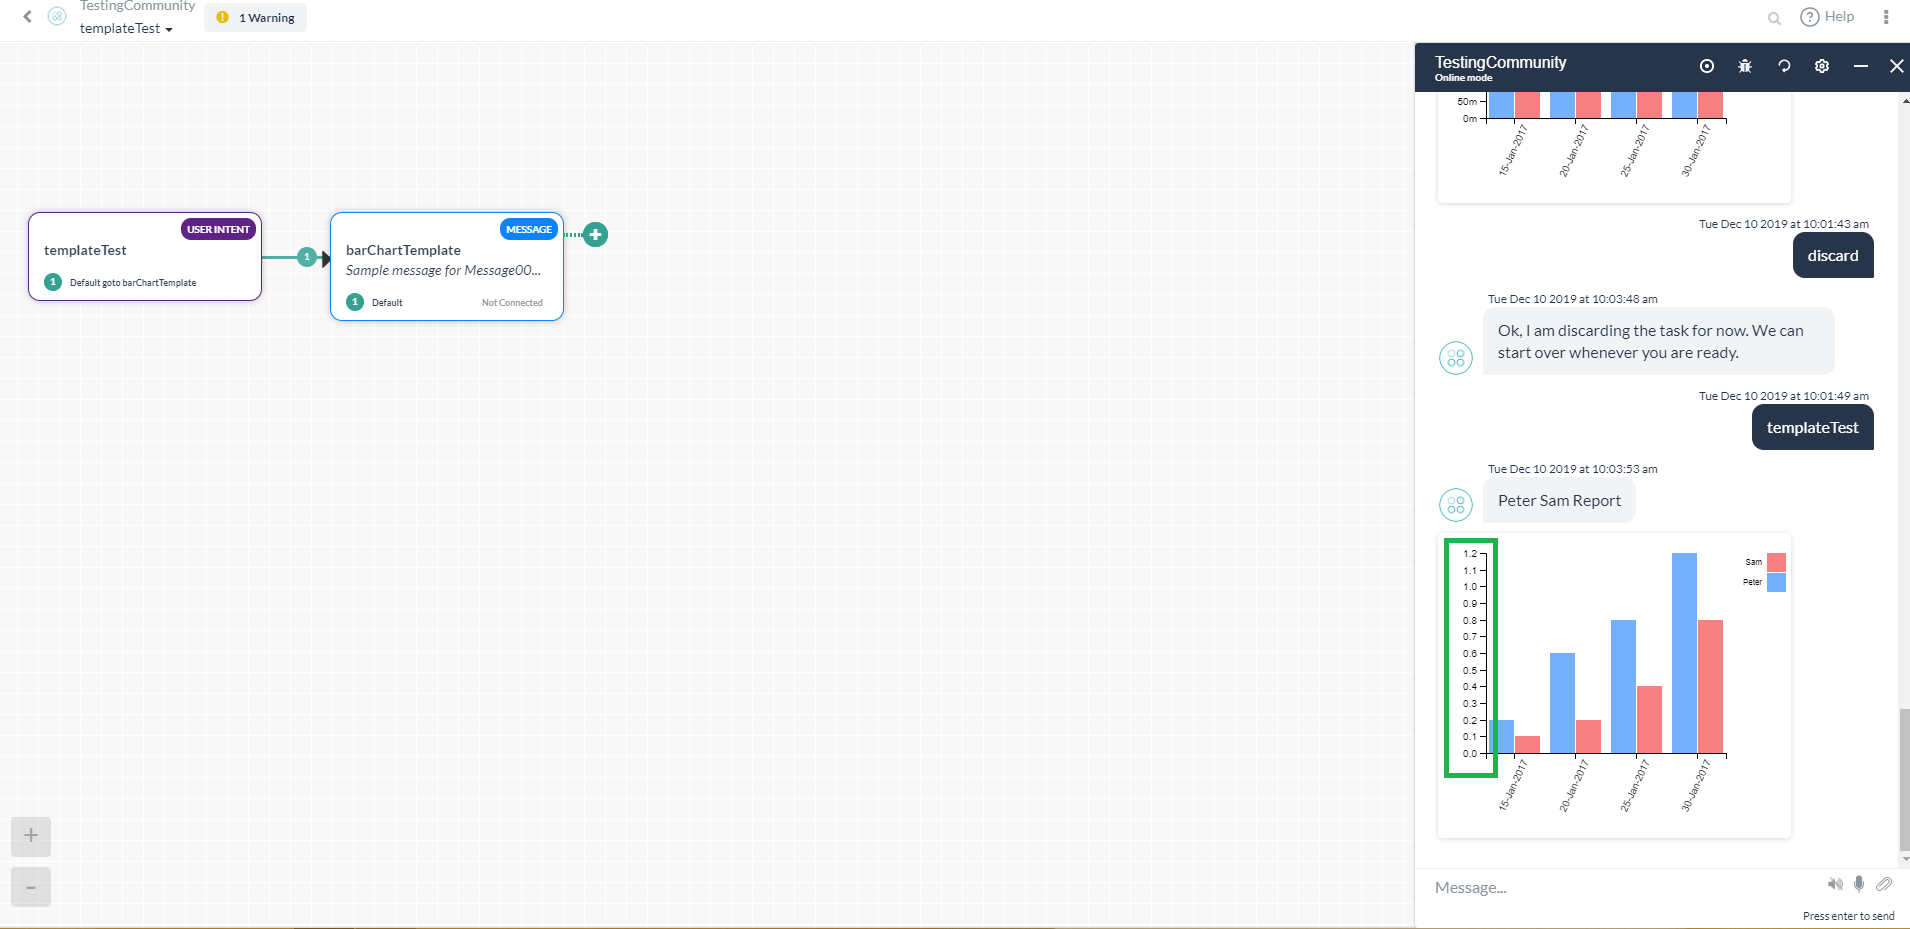
Sharing sample code snippet for bar chart template with customized values which may help you in solving the above stated issues.
var elements = [{
“title”: “Peter”,
“values”: [0.2, 0.6, 0.8, 1.2],
“displayValues”: [“10ml”, “5ml”, “15ml”, “20ml”]
},
{
“title”: “Sam”,
“values”: [0.1, 0.2, 0.4, 0.8],
“displayValues”: [“30 mins”, “15 mns”, “12 mins”, “1 hour”]
}
];
var X_axis = [“15-Jan-2017”, “20-Jan-2017”, “25-Jan-2017”, “30-Jan-2017”];
var message = {
“type”: “template”,
“payload”: {
“text”: “Peter Sam Report”,
“template_type”: “barchart”,
“direction”: “vertical”,
“auto_adjust_X_axis”: “no”,
“stacked”: false,
“X_axis”: [],
“Auto_adjust_X_axis”: “yes”,
“elements”: [],
“speech_hint”: “Here is your report”
}
};
var ele = [];
for (var i = 0; i < elements.length; i++) {
var element = {
“title”: elements[i].title,
“values”: elements[i].values,
“displayValues”: elements[i].displayValues
};
ele.push(element);
}
message.payload.elements = ele;
message.payload.X_axis = X_axis;
print(JSON.stringify(message));
Please use web-sdk for custom templates and BotKit if you want to use third party libraries or if you want to use any third party libraries(CanvasJs, ApexCharts, Plotly) to plot any UI, you have to export the chat data and use any software you would like to use.