Problem Statement:
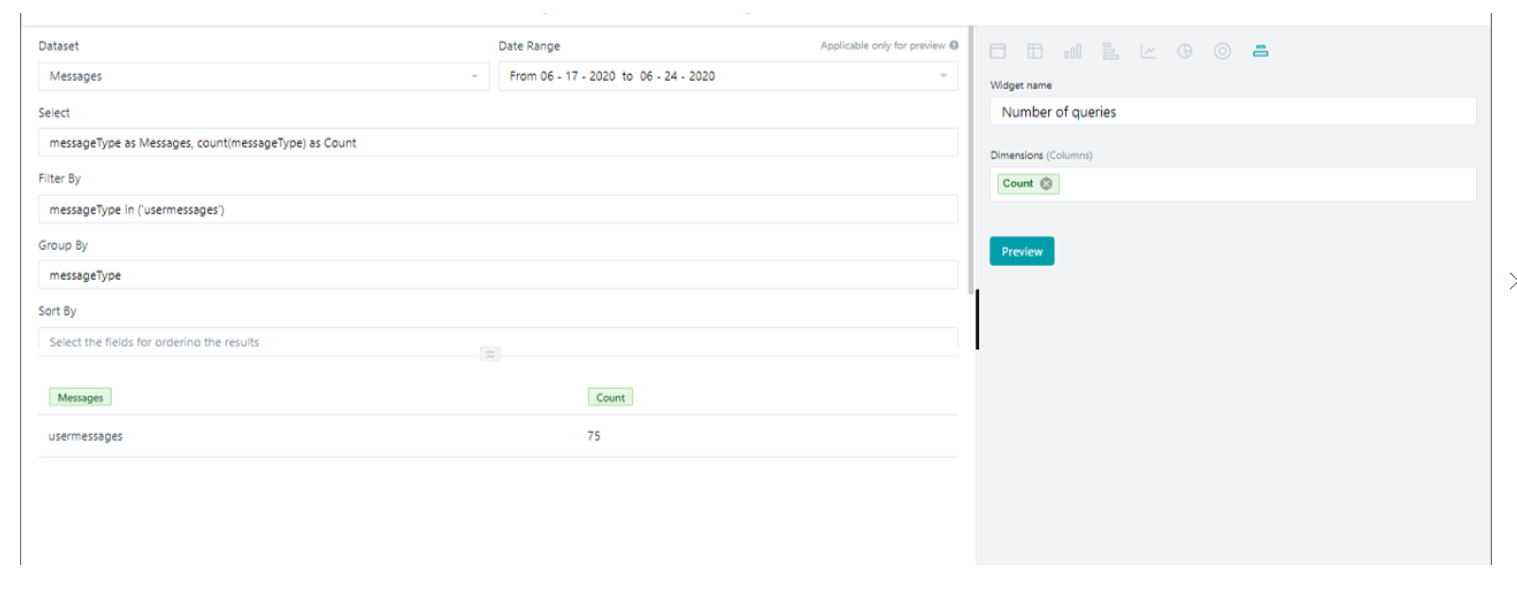
The config for the current issue in custom dashboard:-
Select : messageType as Messages, count(messageType) as Count
Filter By : messageType in (‘usermessages’)
Group By : messageType
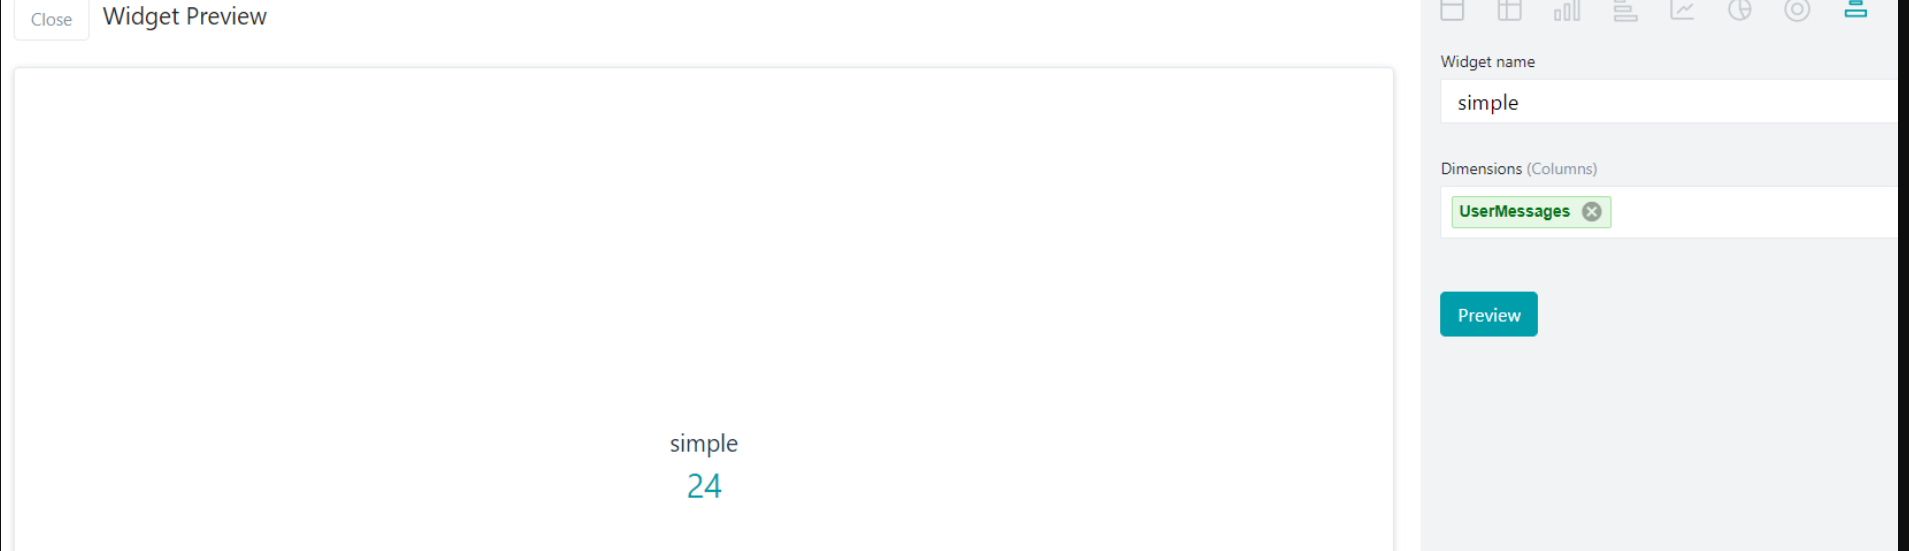
Here when the chart is selected as table and previewed it shows 75 but when the chart is selected on “Label”, it shows “1” .
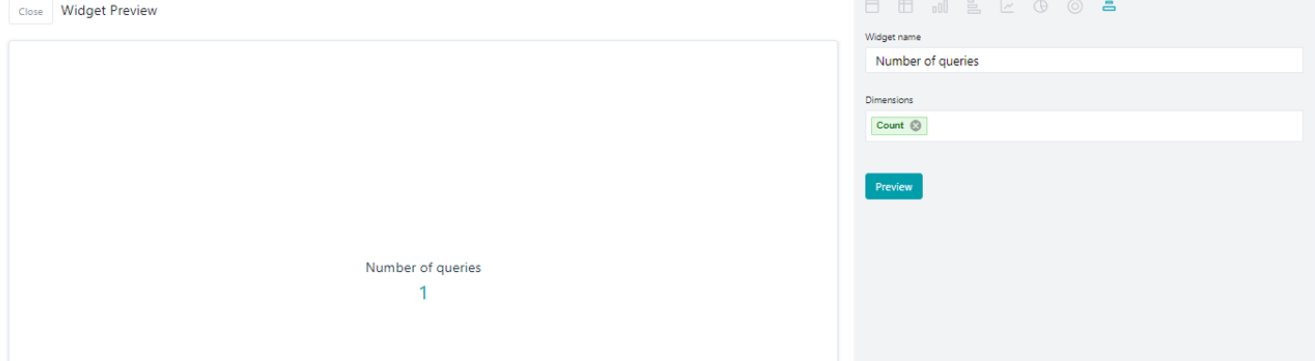
I would like to get the Label chart with the total bot conversation of 75 and not “1”.
Solution:
Label chart is useful when you want to know the no.of different labels.
In the scenario below we have two labels- ’ usersmessages ’ and ’ botmessages ’ for " messageType ". With the filter we further pulled only one of them - ’ usermessages '. Hence, the Label count is 1.
The value of Count is not what will be displayed but the no.of rows (let’s say) that are pulled for the query. So in our query count is aggregating the number of rows along with filter.
If we remove the count and use the query like below it will display data as per the requirement.
Eg:
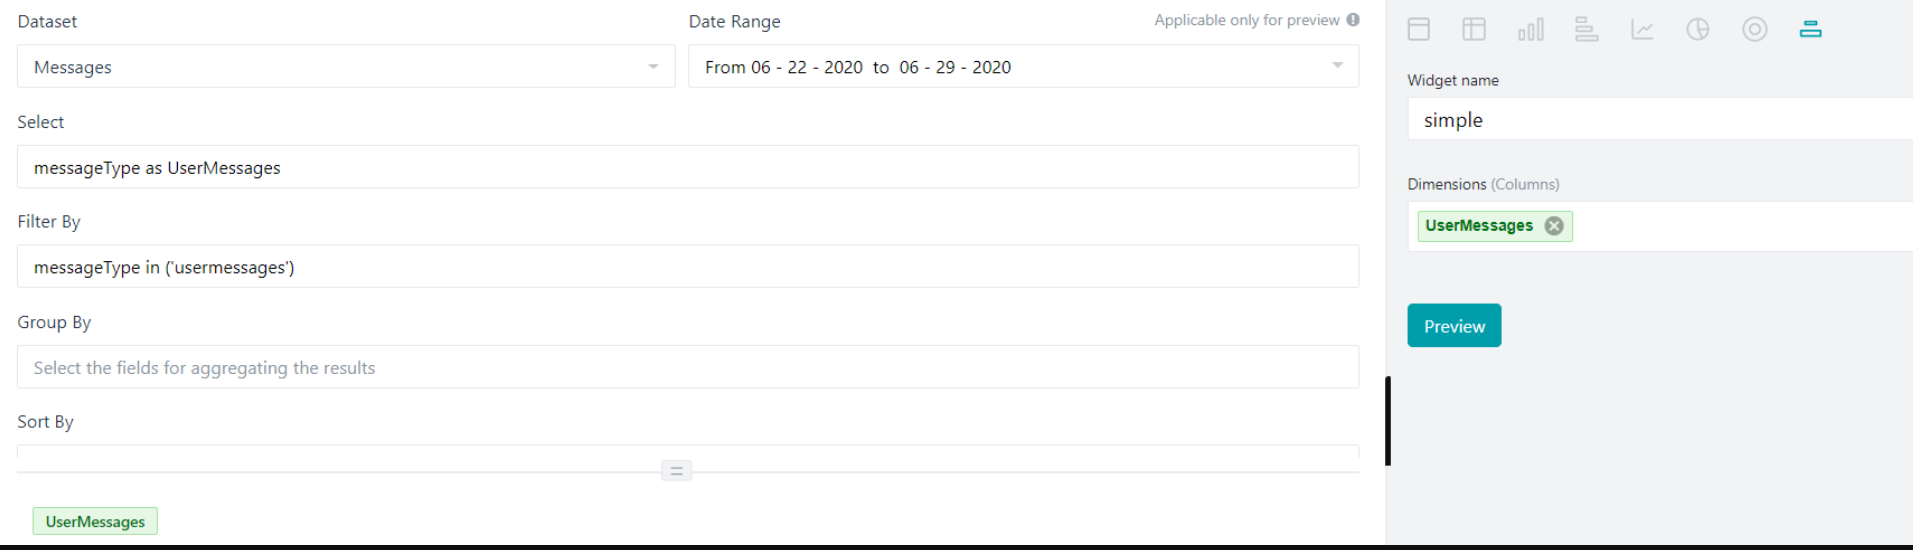
Then the preview shows as: