Kore.ai platform is microservice-based. Almost every functionality is a web-service call that responds in JSON format. This is how user can check the responses or errors if any.
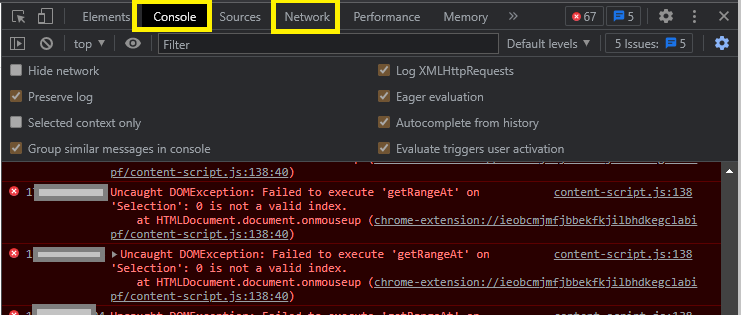
- Press F12 on browser OR right-click the page and select “Inspect”. On Chrome/Mozilla/Edge, Ctrl+Shift+i will work too.
- The console / Network tab should be checked for errors. The console will provide high-level information or JS-related errors, while the Network tab will provide details of the request sent to the Kore platform and the response received.
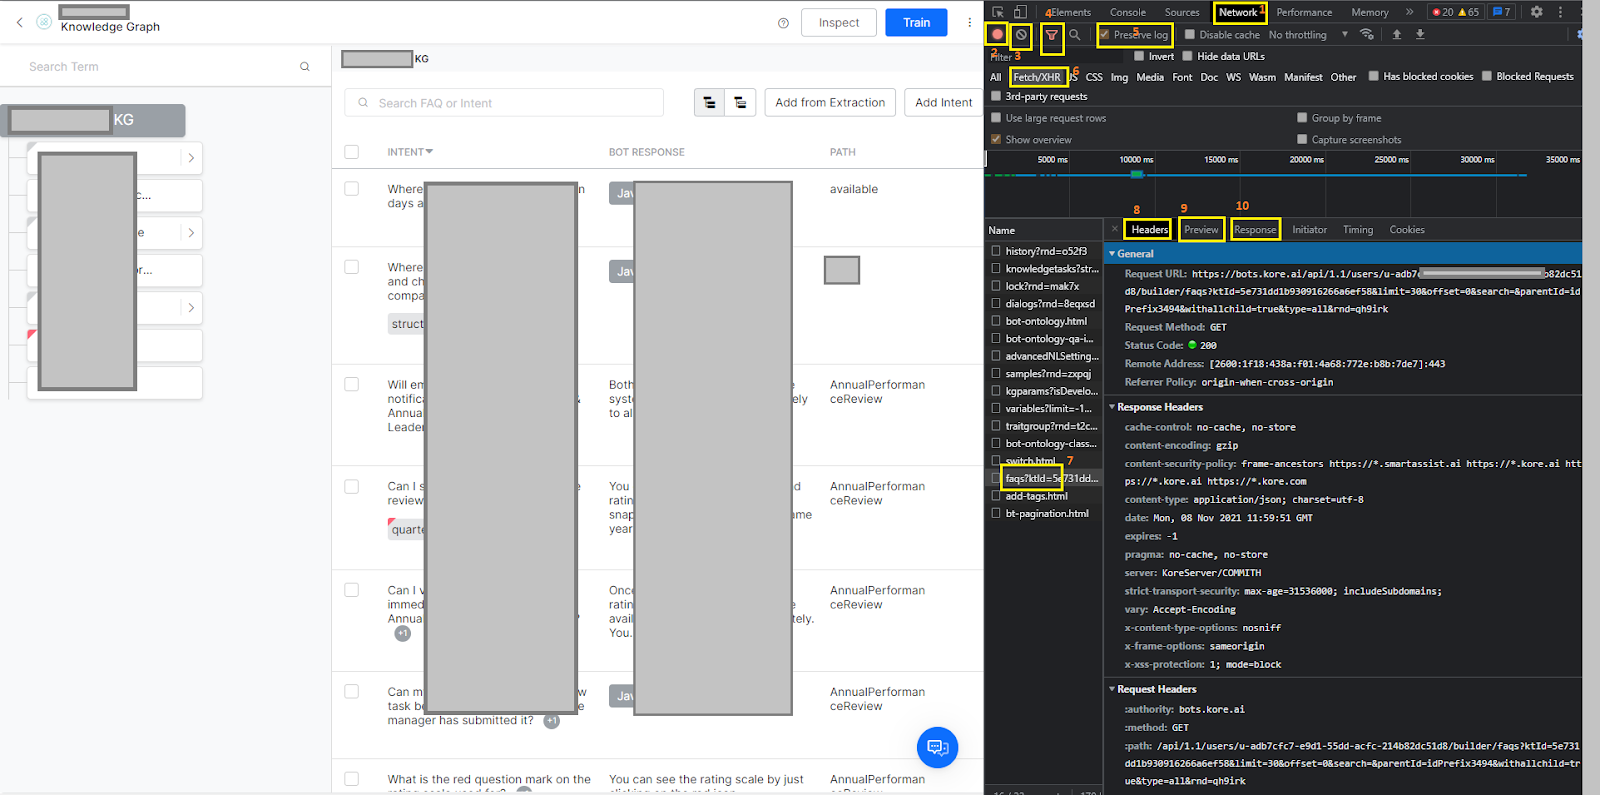
In the browser console [In the following description of how to use this tab properly, there are some references like 1, etc. to the below image]
Network (refer to 1 in the below image) tab can give a lot of information. Ensure that the network activity is being recorded/logged (2). If there are too many entries in already being shown, for a fresh capture, consider clicking the clear button (3). The filter icon (4) helps you capture only API calls - Fetch/XHR(6) and not loading of all the page components. Select ‘preserve logs’(5) if you want to capture API calls across multiple application pages. You may click on any API being called like the “faqs”(7) which is called while loading knowledge graph. You will be able to see several important details in the ‘Headers’(8) - Note KT ID, Parent ID, etc., ‘Preview’(9), and ‘Response’(10) tabs. Headers would contain the request that was sent to the Kore platform, and Preview and Response depict the JSON response received.
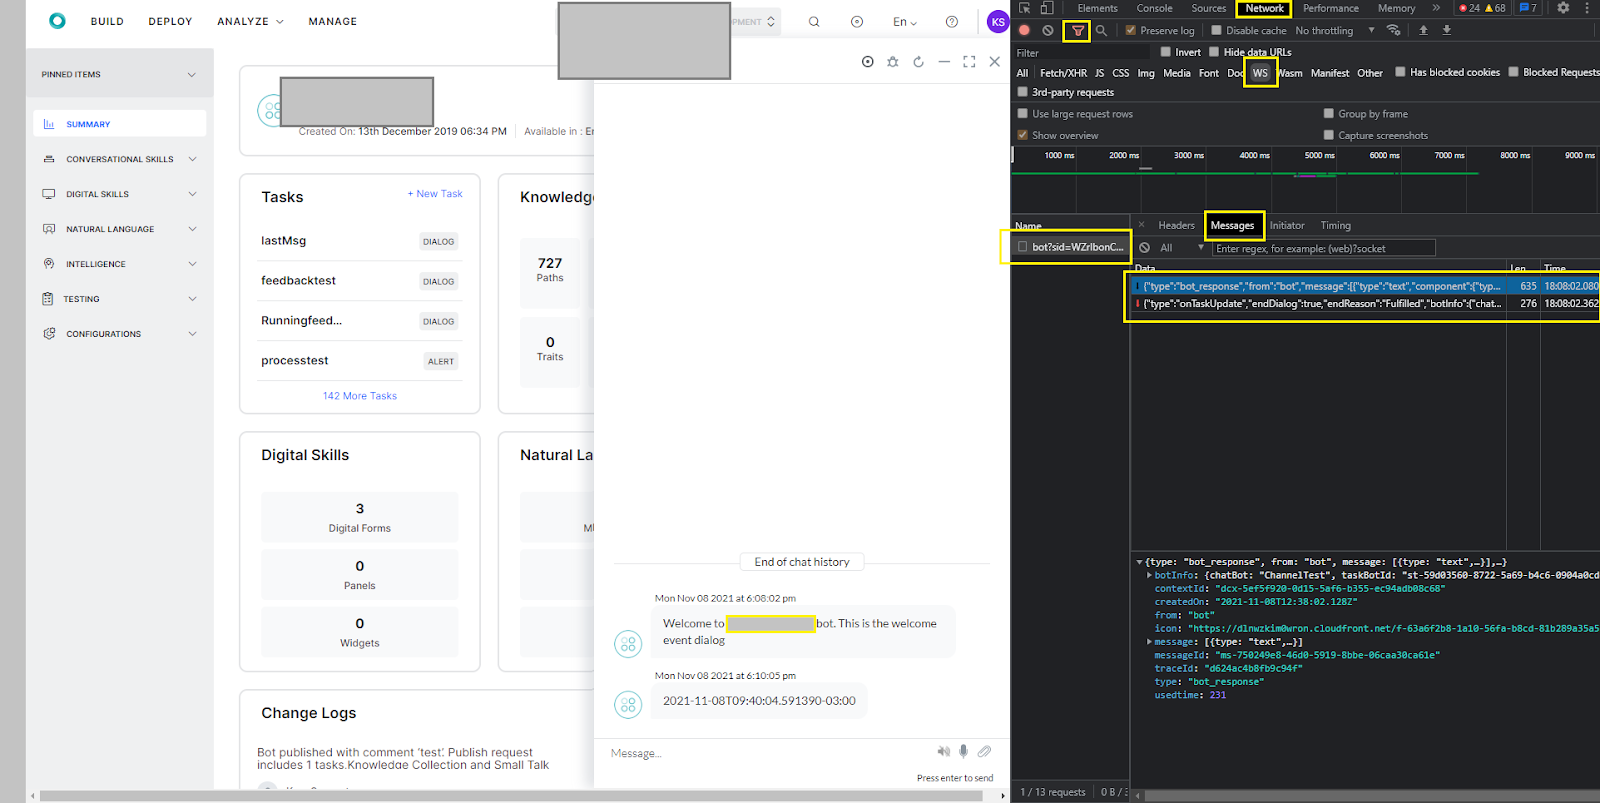
Checking web-socket messages:
In some cases, typically to troubleshoot some rendering issues in Kore-web channel UI, it is important to observe if a message was sent to the web client by the Kore platform. Kore web channel works on WebSocket connection. Once a web-socket connection is established, it is maintained automatically by the web-SDK. Any message to and from the bot are captured in the web-socket connection.
First, refer above to navigate to the Console> Network tab. Then under filters, instead of Fetch/XHR select WS. You should be able to see at least one active web-socket connection and under the ‘Messages’ tab, the messages to and from the bot can be observed. To keep the web socket connection active, by default the web-SDK would initiate a ping-pong. Those details are also available under this tab.